
Refining and Expanding Campus Tree Species Selections
Past efforts by University of Arizona faculty research yielded a rich collection of arid adapted tree species that both helped create Arizona’s economic base in the early 20th Century and produced innumerous species populating urban landscapes throughout the southwestern US. However, limitations on plant performance have and will continue to become increasingly challenging in the decades ahead. Though improved tree selection yield myriad community and environmental health benefits, those benefits will only be realized to the extent that we can accurately match new tree species to current and future climate variables. This project leverages availability of contemporary global data sets that inform potential of tree species found throughout the world to perform well here given the current climate of Tucson, Arizona. By extrapolation, observations of tree species in regions hotter, colder and drier than Tucson will be considered as "climate-ready" selections to be introduced to campus for performance assessment studies.
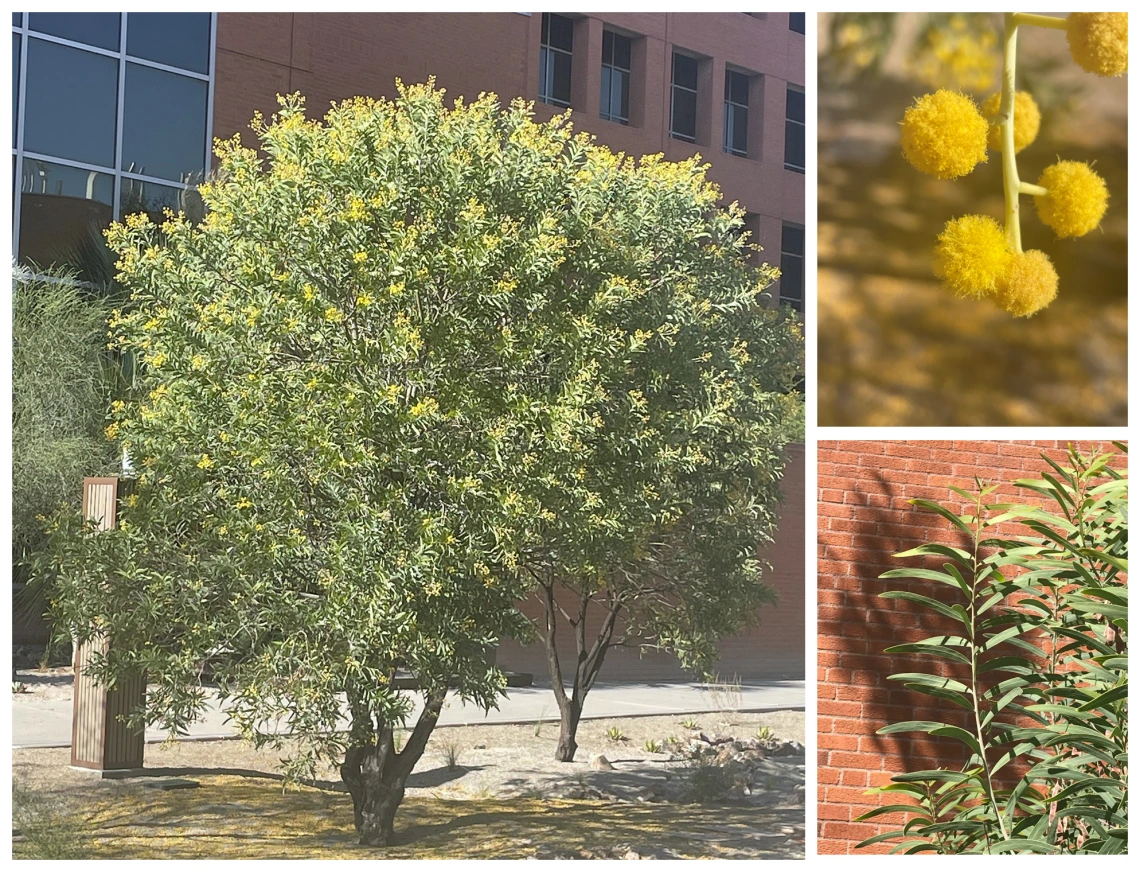
Acacia pruinocarpa occurs naturally in the Northern Territory and in the Pilbara Region of Western Australia. It was brought to the UA through the Desert Legume Program as heat and drought tolerant choice for Tucson as it has been observed growing in regions where temperatures exceed 47C (118F) and annual precipitation is less than 300mm (11").
In addition to our own research relating to tree species and associated climate conditions, we wish to also collect information from practitioners who can refine our predictions relating to tree performance by sharing experiences that add insight regarding species performance. If you have experience observing or cultivating desert trees, please consider reviewing the list of some candidate species and sharing your insights for species familiar to you. To do so, complete a short survey.
Final Rankings Will Be Released December, 2025.
Given the location of the University of Arizona in a desert biome, and the service commitment embedded in our designation as a Land Grant Institution, early faculty members conducted research and education programs focused on searching for and testing performance of arid adapted woody plants from around the world. Their goal was to determine what plant species could be useful and add value here. As a result of their work many new commodity crops and hundreds of landscape ornamental plants were introduced into the trade. Their work not only helped establish the economic base for Arizona statehood in the early 20th Century but also produced many of the drought arid-adapted species that populate urban landscapes throughout the southwestern US. Further, continuous use of the campus as an experiment station produced a world class research collection, and established a pattern of using the campus as a living laboratory and the practice of using open spaces in support of both university programming and community benefit. The advent of urban forestry as a scientific discipline in the late 20th century has yielded copious studies that validate the importance of this pioneering work at the UA, substantiating the necessity of trees in deriving environmental and human health and in meeting the bottom line in urban communities.
Early studies by UA faculty based tree selection choices on the approximate climate similarity of Tucson to other regions of the world. Their process was to visit and study trees from arid and semi-arid deserts for potential use in Arizona's low desert. They brought those species home to Tucson, planted them on campus and tested performance over time. Those proven to perform were introduced as major agricultural commodities or landscape ornamental trees used in cities throughout the southwest US. On campus, it is clear they did their homework well as many have stood the test of time into the 21st century!
Deserts are characterized by a variety of factors affecting performance. They can be hot and dry, semiarid, coastal, or cold. The Sonoran Desert is hot and dry with cold winters and as climate has shifted, the patterns and magnitude of environmental factors have made it increasingly challenging to find species adapted to all the conditions faced by landscape plants in Tucson. Furthermore, the built environment in which these trees are now planted are distinct and deviate considerably from the “natural climate” experienced outside the city. This combination of global climate changes coupled with the compounding effects of the built environment highlight the need for equally dynamic processes in selecting plants for changing conditions. To adapt, plant selection processes must be continuously refined to ensure they are strategically and thoughtfully paired with conditions of urban planting sites so they will thrive in the decades ahead. Though myriad community and environmental health benefits may result from improved tree selection for current and future climate scenarios, those benefits will only be realized to the extent that we can accurately match new tree species to current and future climate variables.
Fortunately, the world is also flooded with new resources to support refined search processes in identifying climate-ready tree species. Climate classification systems, large datasets specifying global observations of tree species, and improved methods for connecting with a global community of horticultural experts may all help to perpetuate the legacy of testing and trying new tree species for the American southwest. This project aims to build on the UA history of testing tree stress tolerance, assessing performance, and continuously reinvigorating the nursery trade by recommending proven performers. This project will accomplish this goal by leveraging the 21st century resources and data available that expand and refine capacity to curate the tree collection, and better predict potential to perform well in both current and future climate scenarios.
The University of Arizona Campus Arboretum is located in the Sonoran Desert. This biome is characterized by an incredible diversity of vegetation, wildlife, as well as unique soil, climate conditions. The main University of Arizona campus in Tucson, AZ is also located at latitude and longitude coordinates of: 32.248814, -110.987419, positioning it in the middle of the Tucson Metropolitan area (MSA). In 2024, Tucson was home to 1,080,300 residents, experiencing an increase in population of 0.7% between 2022 and 2023, and ranking fourth fastest in population growth out of 12 western Metropolitan areas. Tucson is also among the country’s fastest warming cities. It has a hot, desert, climate (Köppen BWh) with two major seasons, a hot summer and mild winter where freezing temperatures are infrequently experienced.
The mean annual temperature of Tucson, AZ is 70.88°F (21°C). Based on models developed by the Intergovernmental Panel on Climate Change (IPCC), given the assumption of limited emissions (SSP2/RCP4.5), the mean annual temperature of Tucson will be 74.5°F (23.6°C) by 2050, and under the business as usual climate change scenario (SSP3/RCP7.0), the MAT of Tucson is predicted to be 79.7°F (26.5°C). Tucson data available from the National Weather Service as of 2024 indicated the mean temperature of the hottest month (MHM) was 30.05°C, the mean temperature of the coldest quarter (MCQ) was 12.37°C. Additionally, the mean annual precipitation (MAP) was 270mm/yr, while the mean precipitation of the driest quarter was 17.02mm. Based on data from 1991-2020, January and December are the coldest months in Tucson with the normal average cold temperature for January and December, being 66°F (18.9°C). The record low temperature (Tmin) of 6°F (-14°C) was recorded on January 7, 1913. Based on data from 1991-2020, June and July are the hottest months of the year with the normal warm temperature for June and July being 100.7°F (38.17°C). The record high temperature (Tmax) was recorded at 117°F (47.22°C) on June 30, 1990. Since Tucson is classified as a USDA 9a hardiness zone, it rarely experiences temperatures below -8°C (17°F) or above 44°C (112°F) (1). As such, for this study we set these as the target Tmin and Tmax, respectively, for our search criteria. Tucson averages 10.61 inches (269.5 mm) of precipitation per year, concentrated during the North American Monsoon of summer (~7.97” in June to September) and the Pacific storms of winter (~2.64” in December and January). However, the Campus Arboretum Collections Policy which informs succession plans for the Campus Arboretum, permits inclusion of species requiring less than 500 mm (20 inches) of annual precipitation. Given this we set the precipitation limit at 500mm but highlighted those fitting both the temperature criteria as well as the more conservative water requirements.
In this study, we compared observations of the current taxa in our collection to observations of those species globally using the Global Tree Database and research grade iNaturalist observations. The geographic location of tree species observed globally was cross referenced with temperature and precipitation data available from the weather station nearest the observation site. Weather station data was obtained using weatherspark.com (2) and, for Australian observations, detailed and precise station data was obtained from the Bureau of Meteorology (3). In all instances the station name or number, the annual precipitation received at that location. and where the information was available, elevation was also noted. Additionally, the maximum and minimum temperatures reported over the three years preceding the observation date (where this information was available – otherwise the most recent years of data were used).
In addition to collecting global climate parameters for our existing species, we also wished to identify other tree species not previously considered for our collection. To this end, we collated recommendations from the Campus Arboretum's new plants committee gathered over the years 2002 through 2024. We also identified regions of the world where climate was most similar to Tucson, where some of our top performing species naturally occur, or where climate extremes were even greater than in Tucson. In those areas, we mined iNaturalist observations to record all observations of woody plant species co-located there and added those to the species to be considered further.
The initial set of plant species included 1134 taxa (including both arboretum taxa and additional species from our wish list). From this set, only trees with mature height of 10 ft were selected out leaving approximately 500 tree taxon in the subset. From that subset, taxa were again culled based on a coarse estimation of water use. Specifically, trees growing in areas with annual average precipitation exceeding 600mm were removed. As such, the taxa remaining for further consideration included 190 tree species. These were estimated to be either exceptionally tolerant to high temperatures, cold temperatures or both and with low probability of needing excessive supplemental water at maturity.
While temperature is the primary limitation for plant survival (and water consumption relates to plant cooling), we wished to evaluate tree species for use in urban contexts where microclimatic factors can be a significant factor in tree performance. To further refine predictions regarding urban climate adaptation of these taxa we collected input from practitioners who had experience cultivating those species or who had observed these plants growing in their native environment. To accomplish this, we invited those with expertise related to performance of potential trees in cultivated or natural settings (in urban forestry, conservation horticulture, botany or landscape architects) to provide input via an electronic survey. This input validated upper and lower temperature thresholds experienced in those settings where tree species are common, gleaned insights relating to plant health and performance and yielded additional tree and shrub species to consider.
Ultimately, we collected an average of 3.157 sample observations and associated climate data for each of the 190 species considered.
For each observation, associated maximum and minimum temperatures known in the observation region and associated annual average precipitation (with presence or absence of irrigation) at the observation site was scored. The average scores for heat, cold, and water were then calculated for each species across all observation sites. These scores formed the basis for ranking tree species based expected cold, heat and drought tolerance.
Scoring was done according to the following rubrics:
Scoring Cold Tolerance: All tree species were scored based on the Tmin recorded at each of the species' observation sites.
- < -8.3°C (<17°F) score: 3
- -7.8°C to -6.7°C (18-20°F) score: 2
- -6.1°C to --3.9°C (21-25°F) score: 1
- > -3.3°C (>26°F) score: 0
Scoring Heat Tolerance: All tree species were scored based on the Tmax recorded at each of the species' observation sites.
- 45°C - 49°C (>113-121°F) score: 3
- 41°C-44.4°C (106-112°F) score: 2
- 38°C- 40.6°C (100-105°F) score: 1
- 37.8°C (<100°F) score: 0
Scoring Water Use: All tree species were scored based on the average annual precipitation (AAP) recorded at each of the species' observation sites.
- 287 mm (11.3 in) or less AAP score: 3
- 287 mm (11.3 in) or less with irrigation score: 2
- 500 mm (19.7 in) or less AAP score: 1
- >500 mm (19.7 in) or less AAP score: 0
After assigning a score for each species, we were able to sort and rank the tree species based on heat, cold, and water scores. The tree species were separated into classes based on the following scoring criteria:
- Heat Class A - average score of 3.0 for all observation sites.
- Heat Class B - average score of 2.0 but less than 2.99
- Heat Class C - average score of 1.0 but less than 1.99
- Heat Class D - average score less than 1.0
- Cold Class A - average score greater than 2.0 (most cold hardy)
- Cold Class B - average score greater than 1.0
Cold Class C - average score less than 1.0 (least cold hardy)
- Water Class A - AAP of 287mm (11.3 in) or less
- Water Class B - AAP of 287mm (11.3 in) or less with supplemental irrigation.
- Water Class C - AAP of 288 mm to 500 mm (19.7mm)
- Water Class D - AAP exceeding 500mm (19.7 in)
This process yielded three lists of trees ranked according to heat tolerance, cold tolerance and water use. By adding scores for all three environmental factors, a fourth list was generated which compares "overall" adaptation of the tree species relative to each other.
References:
1. https://www.weather.gov/twc/TucsonDailyRecords
2. Weather spark.com
3. http://www.bom.gov.au/
Final review is in process - rankings will be posted in December 2025.
Semi-Finalists that rank highest for overall adaptation to cold, heat and drought are shown here as an excel spreadsheet or pdf file. Cells in grey rank highest overall, while blue, brown and green colored cells on the far right show top ranked species for cold, drought, and heat, respectively.
Ultimately, the woody plant species considered will be planted on campus for performance testing and evaluation, with the long-term goal of informing arboretum collection development and landscape succession plans.